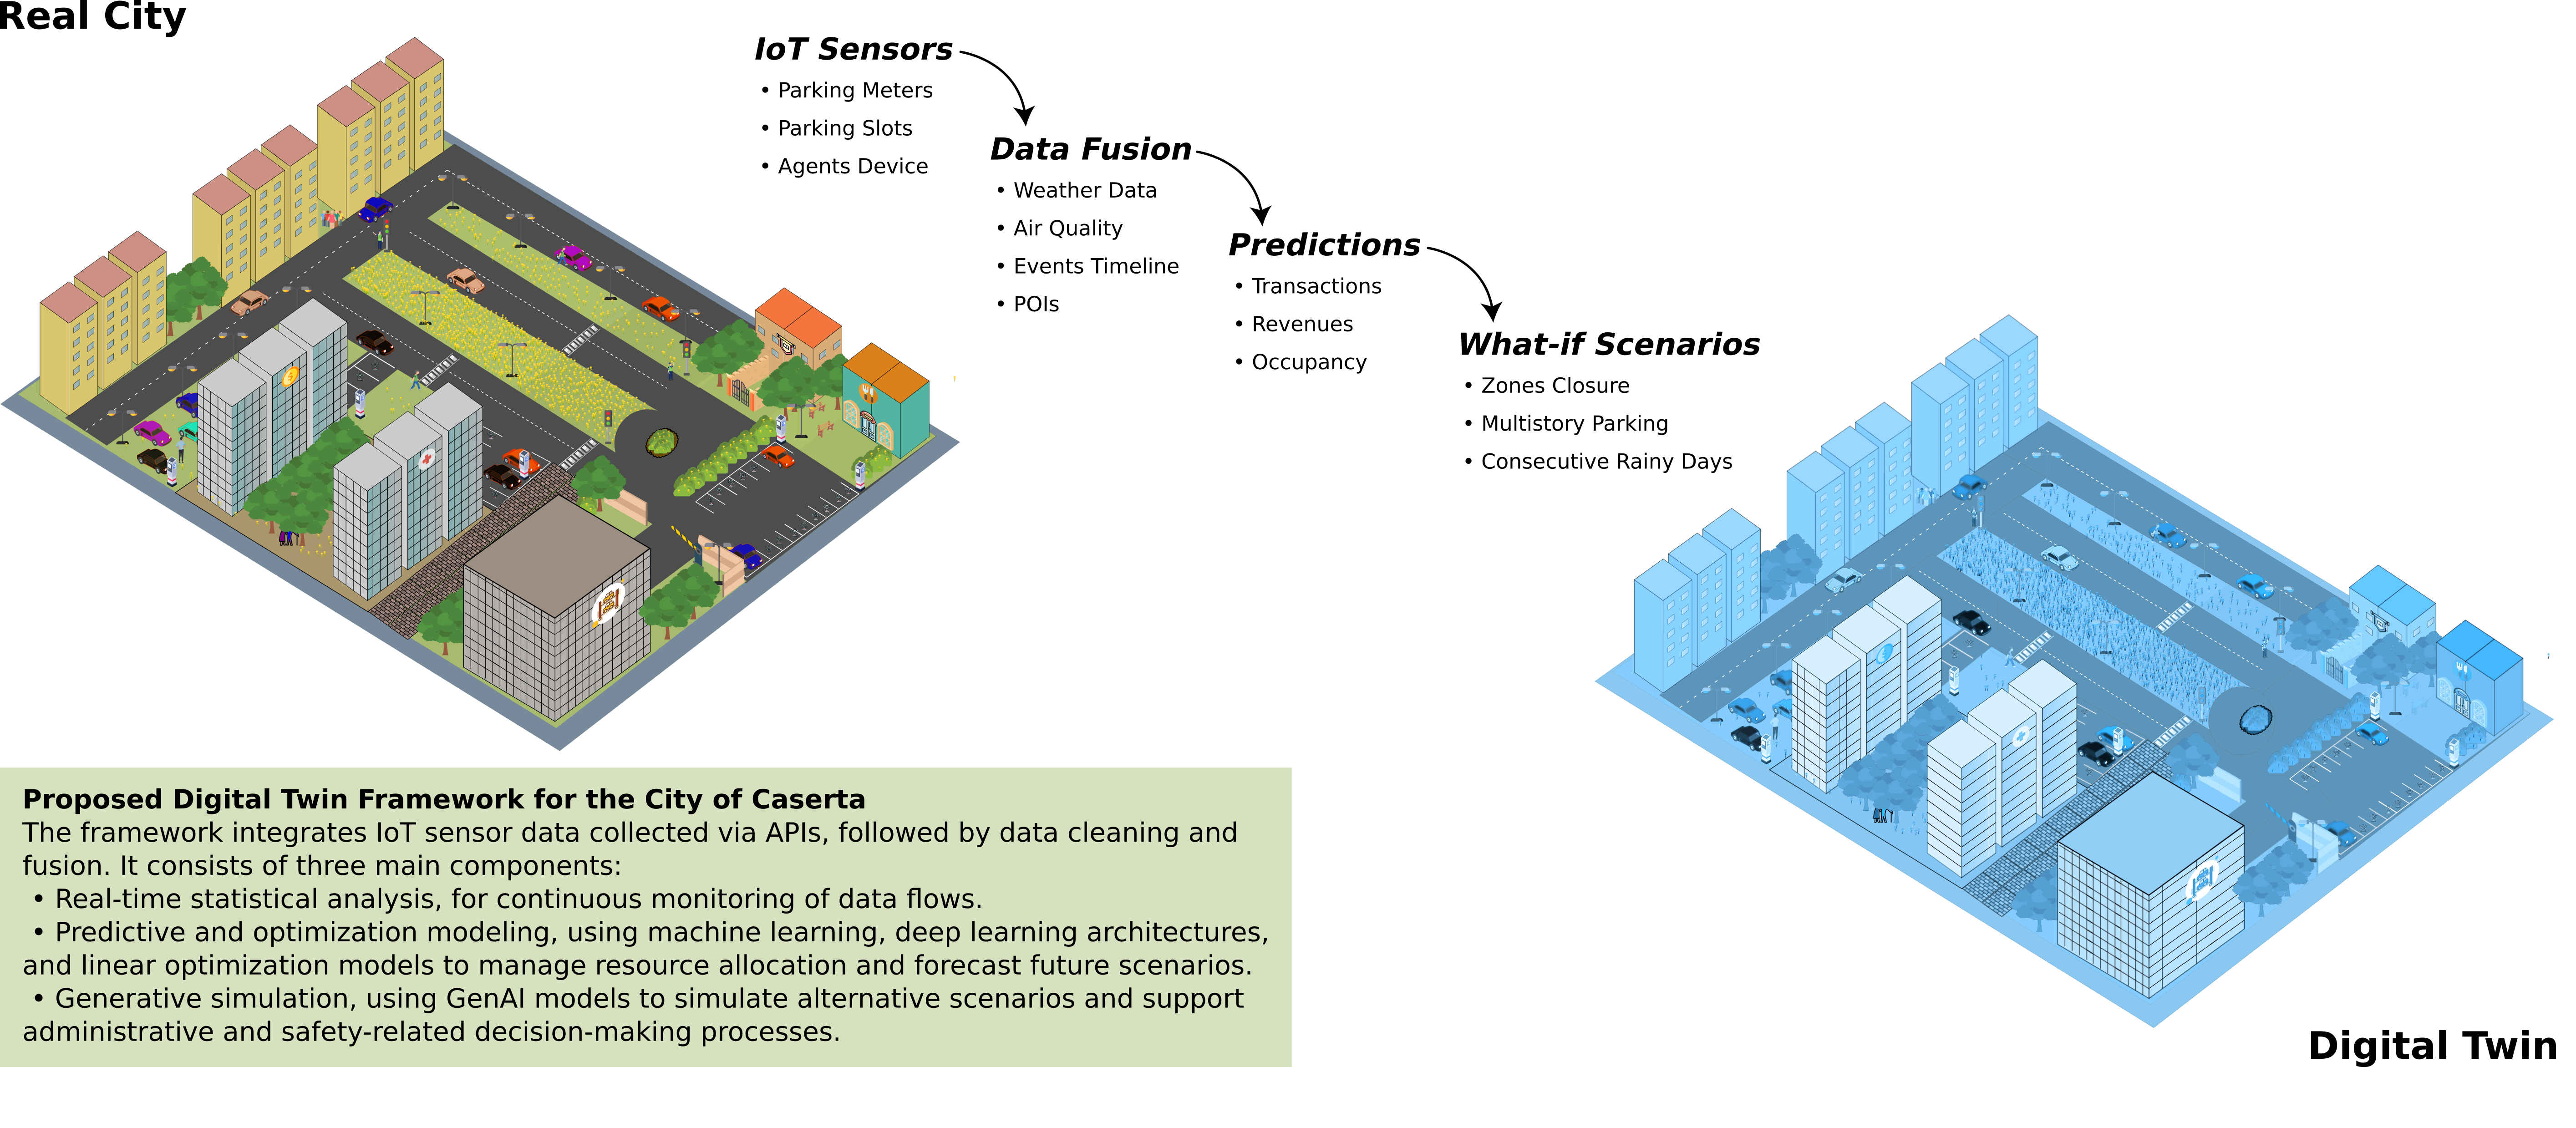
Rapid urbanization and population growth have created significant challenges in urban mobility management, such as traffic congestion, inefficient public transportation, and environmental pollution. This paper presents the development and implementation of a Digital Twin (DT) platform aimed at addressing these issues within the context of smart mobility. The DT integrates a wide range of historical and real-time data, providing a holistic view of urban mobility conditions. Descriptive statistics are used to identify key patterns in parking occupancy and violations, while advanced Machine Learning (ML) and Deep Learning (DL) algorithms enhance predictive and generative analytics, forecasting parking demand and simulating various mobility scenarios. These insights, combined with visualization tools, map data onto the urban landscape, enabling spatial planning and resource allocation. Moreover, the integration of Generative Artificial Intelligence (GenAI) models significantly improves the platform's capability to generate realistic what-if
scenarios, allowing urban planners to test different strategies in a virtual environment before implementing them in the real world. The results highlight the DT platform's potential to improve urban mobility management, especially in optimizing parking meter placement and enhancing user experience. While data availability limitations affect long-term prediction accuracy, the model demonstrates robustness and adaptability for extended forecasting, making it a valuable tool for smarter, more sustainable urban planning.
Urban geography plays a pivotal role in mobility management and the optimization of resources related to parking and traffic. The study zone for this research is a medium-sized city with a complex road network, comprising a dense historical center with mixed residential and commercial use, low-intensity peripheral districts, and major road connections intersecting the urban fabric.
This tab enables users to select specific zones of interest within the city of Caserta for targeted analysis and subsequent platform outputs. The zones displayed on the map are defined by the company managing smart mobility, representing patrol areas for agents. These zones often correspond to different time-based parking fee schedules and tariff rates. For this reason, the zones have been retained in their original format to allow the model to effectively simulate, predict, and generate the desired data. Each zone is further enriched with plotted data for relevant parking meters, parking spaces, and road segments. The map is interactive: clicking on any element reveals its corresponding ID for detailed inspection.
Additionally, a detailed table provides real-time information about the selected zones, including key environmental metrics such as Temperature, Humidity, Wind Speed, Precipitation, and Air Quality Index (AQI), all retrieved dynamically through API integration. This dual-layered approach offers a rich spatial and contextual understanding, crucial for effective urban mobility management and resource optimization.
- Loading map info ...
By examining the distributions of transactions, parking occupancy rates, and recorded violations, this tab provides a comprehensive view of urban mobility dynamics, highlighting recurring patterns and specific criticalities within the analyzed context.
On the left-hand side, a selection panel allows users to refine their analysis by choosing specific parameters, such as the zone, the week of the year, and the time range of interest. None of these selections are mandatory, offering users full flexibility in exploring the data. Based on the chosen parameters, the tab dynamically generates plots:
- Transactions distribution: shows the number of transactions;
- Revenue distribution: displays the amount in euros generated;
- Parking slot occupancy distribution: highlights occupancy trends across parking spaces;
- Violation distribution: this plot appears only for time ranges during which parking fees are applicable and shows the distribution of issued fines.
For each plot, a detailed interaction panel is available on the right-hand side: for the transactions and revenue plots, users can select a specific parking meter; for the parking slot occupancy plot, users can select a specific parking slot and toggle between the distribution of legal and illegal occupancy. Each selection made by the user is visually reflected on the mini-map within the tab, with the corresponding element (zone, parking meter, or slot) highlighted for clarity.
This functionality is designed to facilitate detailed and dynamic exploration, enabling decision-makers to uncover inefficiencies and improve resource management in urban mobility systems effectively.
Transactions
Revenue
Parking slot occupancy
Fines
The statistical analysis in this tab plays a pivotal role in understanding urban mobility dynamics, offering an in-depth view of resource utilization and user behavior across selected zones and time ranges.
On the left-hand side, the layout mirrors the data distribution tab, featuring a selection panel where users can refine their analysis by choosing a specific zone, week of the year, and optional time range. Additionally, a mini-map dynamically highlights the selected elements, providing spatial context. If no selection is made, the data displayed represents cumulative information for the entire city. The main content of the tab is organized into eight panels split into four pairs:
- Correlation Heatmaps: the left heatmap shows the correlation between the Abusivism Index and the Number of Fines for the selected zone; the right heatmap extends this analysis to the entire city, providing an absolute perspective.
- Usage Statistics: the left panel displays key metrics for parking meters; the right panel focuses on parking slots, providing also daily influx trends.
- POI and Events Analysis.
- Abusivism and Fines Breakdown: presents the Abusivism Index and Number of Fines metrics segmented by agent shifts (morning, afternoon, evening), highlighting trends, p-values, and Sen's Slope.
All content in the tab is dynamically updated based on user selections, empowering decision-makers to explore detailed insights into the interplay between mobility patterns, parking behavior, and urban events.
Correlation Heatmap: Abusivism Index vs Number of Fines (relative)
Correlation Heatmap: Abusivism Index vs Number of Fines (absolute)
Loading statistics ...
Properly managing agents' shift schedules is essential to urban operations, boosting the effectiveness of field activities and enabling timely responses to citizens' needs.
In this tab, users can explore and interact with the weekly calendar of agent shifts, designed to align coverage with the payment hours for parking and the required control periods.On the left-hand side, a selection panel allows users to choose the specific week of the year they wish to analyze, as shifts are organized on a weekly basis. If no selection is made, the tool defaults to displaying the shifts for the most recent week. The calendar view is structured by days of the week, with each day further divided into hourly slots from 08:00 to 24:00, corresponding to the time ranges when parking payment and agent patrols are required. Shifts are generated in accordance with the contractual working hours allocated to each agent. Future enhancements will include the ability to incorporate agent preferences, such as:
- specific days and hours of availability;
- requests for time off or leave;
- and custom scheduling adjustments based on individual needs.
By providing a clear and flexible interface, this tab empowers administrators to visualize, evaluate, and optimize shift allocations. Built on Key Performance Indicators (KPIs)—such as detected violations, average response times, coverage efficiency, and shift management metrics—the calendar facilitates data-driven decisions to enhance operational efficiency and improve urban mobility management.
Loading calendar ...
Anticipating trends through predictive modeling is essential for effective urban mobility management, enabling data-driven strategies to optimize parking and resource allocation. In this tab, users can explore the outputs of the forecasting model.
On the left-hand side, a selection panel allows users to choose the zone of interest and the week of the year for which predictions are displayed. A mini-map dynamically highlights the elements corresponding to user selections, providing spatial context to the forecasted data. The main content comprises three plots, each displaying week-by-week results:
- Transactions forecast: predicted vs. actual transaction volumes;
- Revenue forecast: predicted vs. actual revenue generated from parking;
- Occupancy forecast: predicted vs. actual street-level parking occupancy rates.
By default, the tool shows general results for the entire city, including real data, the average predicted values, the minimum and maximum time series, highlighting the oscillation range of the data across the city. When a specific zone is selected, the plots update to display localized predictions, allowing users to drill down into results for individual parking meters or streets. These elements are simultaneously highlighted on the mini-map for ease of reference. The comparison between real and predicted data emphasizes the model's robustness and performance, showcasing its reliability in capturing complex urban mobility dynamics.
Forecasting not available.
Transactions
Revenue
Parking slot occupancy
The generative component employs a tailored Generative Adversarial Network-based architecture to address the complexity of multivariate time-series generation. Such model takes as input a combination of real data and user-defined hypothetical conditions.
The What-if scenarios
tab enables users to simulate scenarios based on real-world data using an this advanced artificial intelligence methodology. This tool was developed to support strategic decision-making in urban contexts, allowing users to evaluate the potential impact of significant changes in three key areas: Temporary Roads or Zones Closures, Construction of a Multistory Parking Facility, Consecutive Rainy Days. While real data is used as a foundation, the simulated scenarios do not have a direct real-world counterpart but rather represent projections based on the selected conditions.
Once each simulation runs, the relative tab displays various plots that help evaluate its impact on parking demand. These include:
- Real and Generated Data Heatmaps: displays parking activity in Caserta based on actual data and simulates parking activity under the selected scenario.
- Radar Plot: highlights the effect of the simulation on all zones, showing the redistribution of demand across the city.
- Bar Plot with Associated t-SNE: visualizes changes in parking activity and clusters zones based on their response to the simulation.
- Line Plot: compares time series trends of parking demand between generated and real data.
Using a fully data-based methodology, it is possible to explore future scenarios without real-world changes.
In this tab, users can simulate the closure of a specific area in the city of Caserta. For simplicity, we have implemented the option to close an entire zone; however, our model is capable of generating data for more granular scenarios, such as the closure of a single road or the deactivation of an individual sensor. The simulation begins only after the user specifies their zone and the year's week of interest. Until then, a message appears.
The selected zone corresponds to the deactivated/closed
area. A mini-map displays the selected zone, the sensors involved in the selection, and the nearest adjacent zone or zones most affected by the imposed closure, based on a distance threshold.
The simulation results contribute to evaluating the impact of a parking zone closure on parking meters and parking slots. The findings reveal that while the closed zone becomes inaccessible, adjacent zones experience a significant increase in activity due to the redistribution of demand.
Waiting for the user to run a simulation ...
Heatmap
Transactions
Real data
Generated data
Parking occupancy
Real data
Generated data
Distribution
Transactions
Parking occupancy
Cumulative time series
Transactions
Parking occupancy
In this tab, users can simulate the installation of a multistory parking facility in a selected area of interest. Besides choosing the installation zone and the week of the year for the simulation, users must specify the number of additional parking slots the facility will provide, with a minimum default value of 30 slots. This ensures that users can immediately appreciate a redistribution of parking demand that accounts for the new installation.
The simulation only begins once the user inputs their selection. Until then, a message appears. A mini-map highlights: the selected zone; the sensors within the selected area; the nearby zones most impacted by the additional parking slots, determined by a distance threshold.
The results demonstrate the effects of the new parking facility, showcasing a decrease in activity within the selected zone and its neighboring areas. This redistribution leads to a more even allocation of parking demand across the city, reducing congestion in high-demand areas and providing actionable insights for urban planning and resource optimization.
Waiting for the user to run a simulation ...
Parking occupancy heatmap
Real data
Generated data
Parking occupancy distribution
Parking occupancy cumulative time series
In this tab, users can simulate the impact of consecutive rainy days on parking occupancy. Beyond selecting the zone and week of the year for the simulation, users can explore how prolonged rainfall influences parking demand. The simulation only starts when users provide their inputs. Until then, the interface displays a message.
Users can select the desired week of the year, and observe how demand fluctuates across different urban areas. All showed results represent cumulative data for the entire Caserta area under consideration. Additionally, for parking occupancy time series, users can select a specific area of interest to view detailed results. A mini-map highlights the entire area, or the selected zone, and sensors within.
The analysis reveals how adverse weather conditions lead to variations in parking demand. This enables a deeper understanding of weather-related mobility adaptations and parking dynamics.